What is Dashboard? The importance of Dashboard in businesses
What is Dashboard? What is the importance of a Dashboard for business? And how to create a standard Dashboard. In this day and age, analyzing and understanding data is the key to making the best decisions for any business. However, the volume of information can be overwhelming for the most data-savvy. The dashboard was born as an optimal solution to help businesses solve the problem.
1. What is Dashboard?
A dashboard is a table containing various types of visual data that has been processed and displayed in the form of tables or diagrams. With its flexible feature, the Dashboard also automatically changes in real time so that businesses can easily compare and evaluate work accurately.
In addition, the Dashboard not only provides in-depth data on the production and business processes but it also gives an overview of each department’s performance, trends, activities, and indicators, KPIs (Key Performance Indicators – also known as performance evaluation index).
2. Uses and benefits of Dashboard
With the information that has been given above, we have answered the question of what a Dashboard is. So what is the use of a Dashboard and the benefits that a Dashboard brings to businesses when using it will be explained in the next section.
2.1 Uses
The key use of a Dashboard is to display data from different sources in a comprehensive, easy-to-understand manner. Dashboards are useful for tracking, measuring, and analyzing data related to your business. It takes raw data from multiple sources and presents it clearly so anyone can understand – whether you’re a business leader, business analyst, sales rep, home marketing, etc.
The dashboard is also used to measure: Customer metrics, financial information, sales information, website analytics, production information, human resource data, marketing performance, etc.
Because Dashboards are data aggregators and very flexible — used by professionals to analyze complex data or to monitor or present data, using the Dashboard in presentations to directors or stakeholders will help them better understand the challenges, opportunities, and possibilities for growth and change implementation.
2.2 Benefits
Every company relies on data to make decisions regarding business growth and expansion. Meanwhile, the Dashboard allows data to be displayed quickly and easily.
Therefore, the Dashboard brings a lot of business benefits, Here are (6) main benefits:
- Make the data clearer
- Real-time analytics
- Helping businesses forecast more accurately
- More intuitive presentations
- Increased accessibility and transparency
- Better decision-making and problem-solving
3. What is the importance of a Dashboard?
Dashboards are important to businesses because they provide a platform to aggregate data to help businesses make better, more informed decisions. The dashboard is always updated regularly in real-time, so businesses will have a more accurate and timely understanding of what is happening and make quick decisions.
4. Dashboard Types
To understand more deeply about the Dashboard we need to understand the types of Dashboards. So what are the kinds of Dashboards? How to classify the types of Dashboard. The dashboard is difficult to categorize because it is flexible and customizable. However, we can divide the Dashboard into (7) main categories.
4.1 Business Dashboard
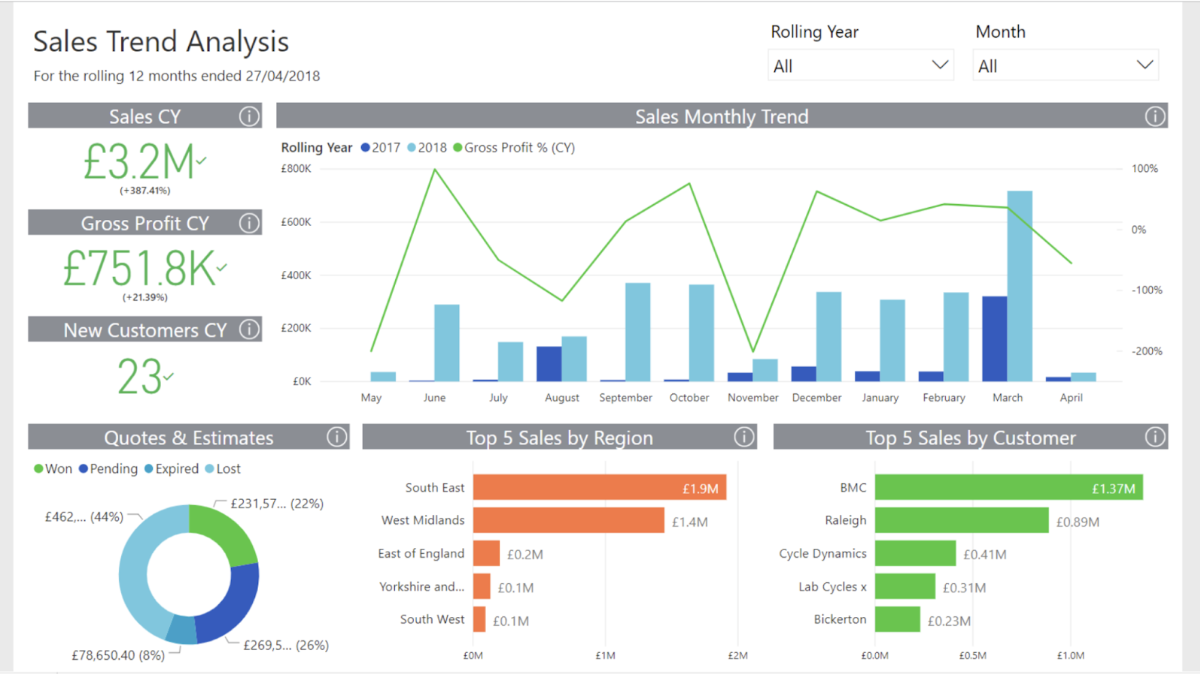
Businesses cannot make solid decisions without data where the Business Dashboard comes into play. They can store all kinds of data ranging from sales, finance, management, marketing, human resources, etc. They are designed to provide managers and directors with data needed to strategically plan and refine ideas.
4.2 Executive Dashboard
An executive dashboard is a type of specific overview of an enterprise’s business situation to visualize important metrics for the executive team. Typically, these data are at a high level and provide leaders with transparency on business operations and performance that helps them make more informed decisions, plan better, and evaluate performance fruit.
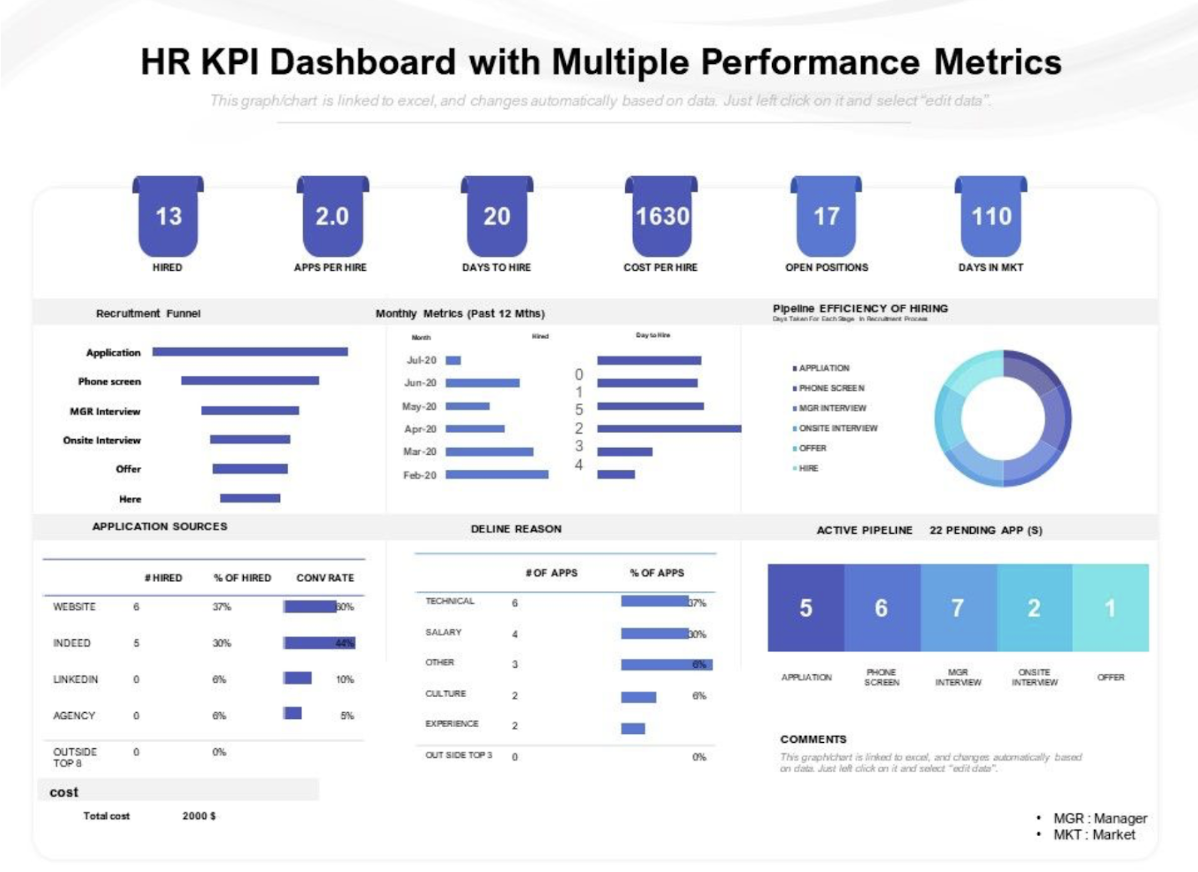
4.3 KPI Dashboard (KPI Dashboard)
Arguably the most important KPI dashboards are when used by professionals and executives or individuals. This type of dashboard visually displays the performance of key data points at a glance, revealing progress towards key goals. The most important part of the KPI dashboard is knowing what your KPIs are and how best to measure them.
4.4 Project Dashboard
When running or managing a large project, this Dashboard is a useful tool for tracking project progress and is shareable with your team and other stakeholders. They provide a complete view of the project status, insights, and key data.
4.5 Performance Dashboard
The Performance Dashboard can track everything from overall business performance to the performance of individual campaigns. They are useful for marketing, finance, advertising, human resources, and other business groups.
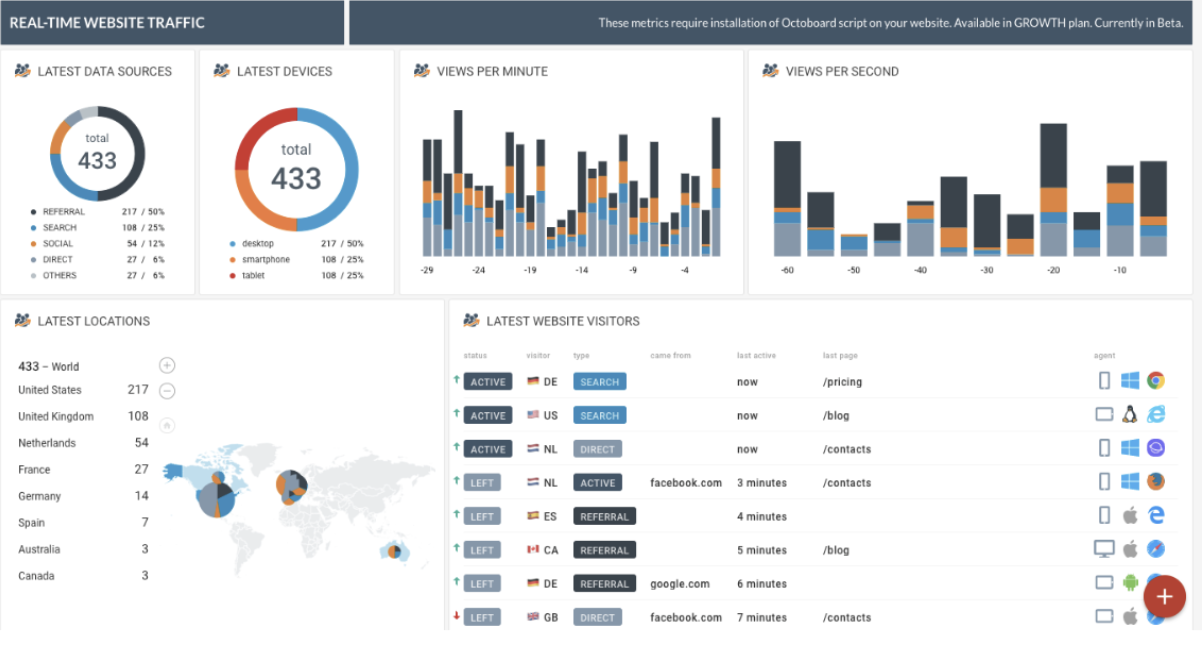
4.6 Website Dashboard
When monitoring website performance, creating a website dashboard is very helpful. Website Dashboard tracks important data such as overall traffic, total users, active users, e-commerce activity, sales, and revenue. Whether the business maintains a simple or complex website, this dashboard can provide a clear, integrated view of the metrics.
4.7 Operations dashboard
It is a common type of business dashboard. Unlike the types of Dashboards mentioned earlier, this type of Dashboard will focus on helping businesses run their day-to-day operations as it provides an overview of the day-to-day operations of the business.
5. How to create a Dashboard?
After understanding the importance and knowing the benefits that Dashboard brings to businesses. So what are the websites that help create a Dashboard and what are the steps to complete a Dashboard? This question will be answered shortly.
There are pages to help create a Dashboard: Tableau, Excel, Google Sheets, and Google Data Studio.
However, here are the basic steps to help you build a standard Dashboard:
- Define your audience and goals: By asking yourself who you are, build this dashboard for and what they need to understand. Once you know that, you can more easily answer their questions with selected images and data.
- Choose your data: Most businesses have a lot of data from different sources. However, we should only choose what is relevant to the audience and target to avoid overloading the viewer with a broad amount of information.
- Double-check data: Always make sure data is clear and accurate before building a Dashboard.
- Choose the correct visualization: There are many different kinds of visualizations to use, such as charts, graphs, maps, etc. So the best one is to represent the data. For example, bar charts and pie charts can be overwhelming when they include too much information.
- Simplicity: Use simple colors and styles so that the Dashboard looks simple to the eyes and doesn’t become cluttered.
- Iterate and improve: Take feedback and find out if it makes sense for them and answer their questions. Also, keep that feedback in mind and make improvements to make the Dashboard better.”
Read more:
Google Data Studio – The perfect tool for data analysis
6. Conclusion
Understanding what a Dashboard is also the importance and benefits of a Dashboard can be seen because of its usefulness and flexibility. The dashboard has become one of the popular tools not only by businesses but also for businesses’ personal use. Currently, more websites have templates available to make dashboard creation faster, easier, and more efficient.