Google Data Studio – The perfect tool for data analysis
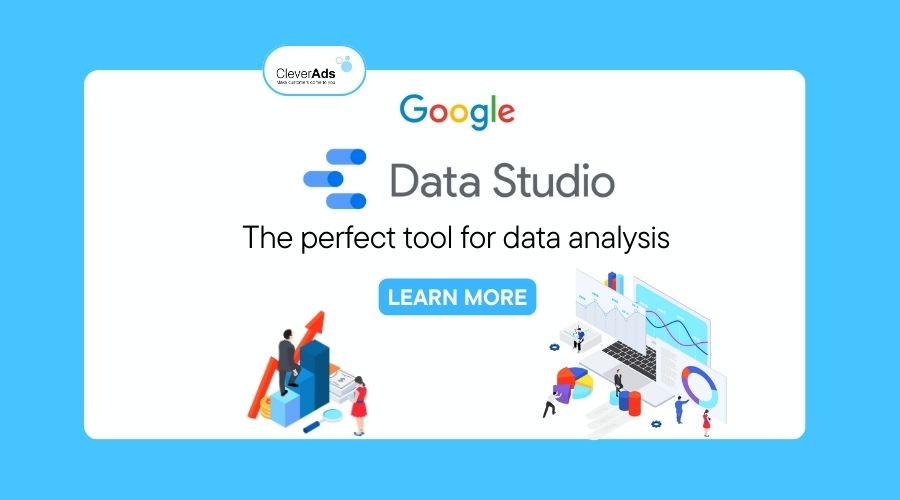
Google Data Studio is a great tool that makes it easy to do data analysis reports, aggregate and share those with your partners. Let’s learn with Cleverads how to use Google Data Studio most effectively.
1. What is Google Data Studio?
Google Data Studio is a tool to help statistics and display data visually and vividly from sources such as Google Analysis, Hotjar, Mixpanel, etc. This tool will help you show it in a report by presenting it and the data through charts and tables.
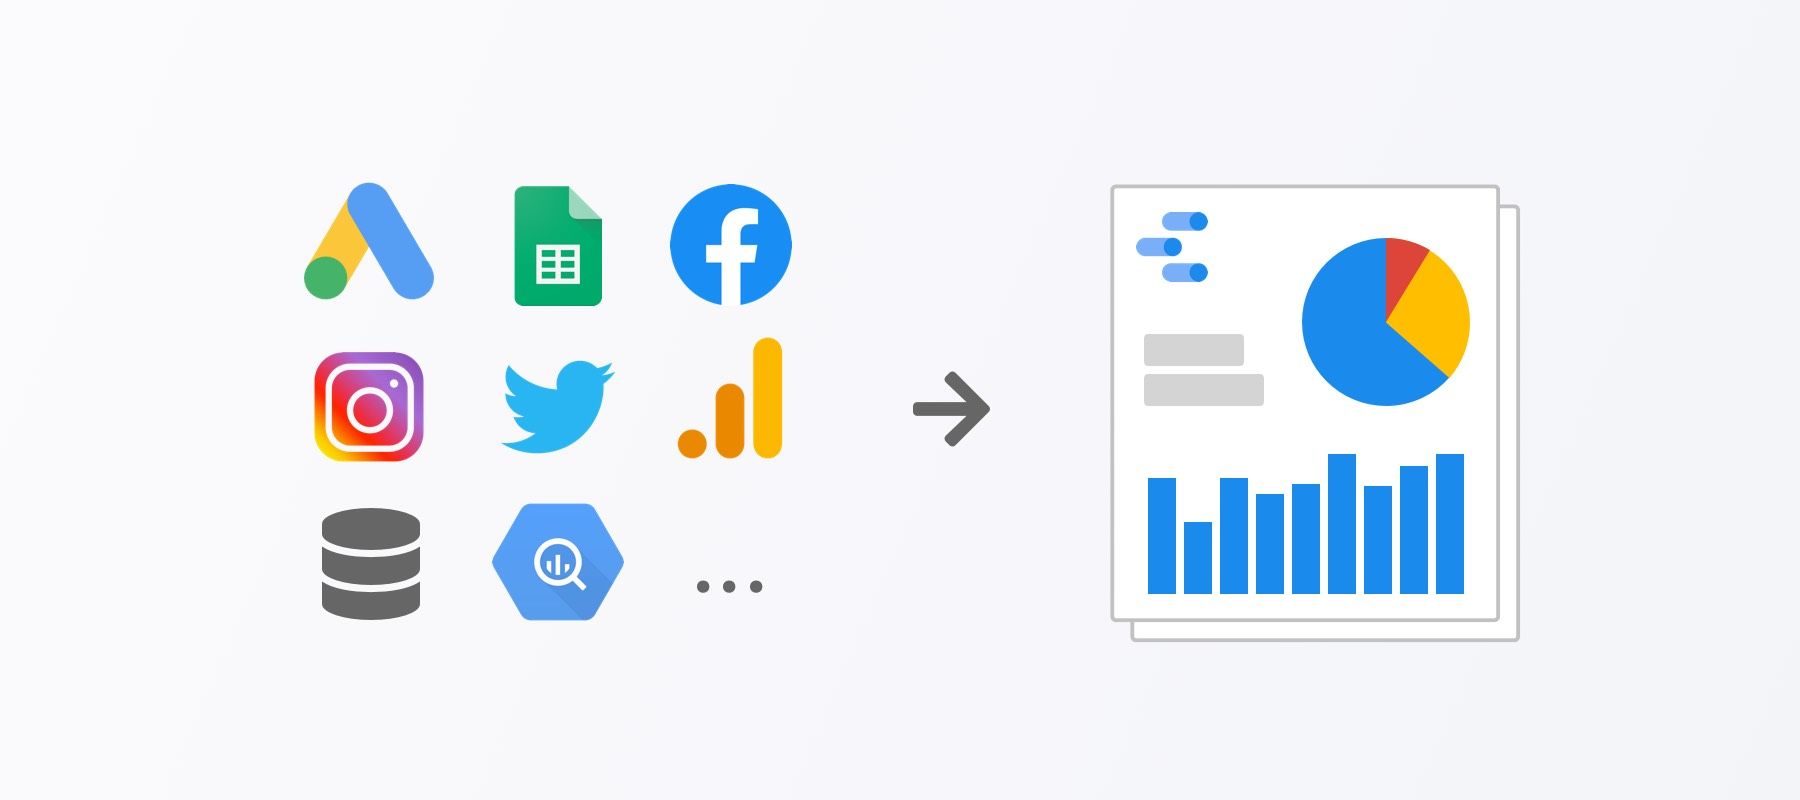
The exceptional feature of Google Data Studio is that you can’t easily make statistics from Google Analysis but also import data from Facebook, as long as those data have been incorporated in the Google sheet. It also means that any data in a Google sheet can appear in your reports.
2. Benefits of Google Data Studio
2.1. Actively design appropriate report templates
Google Data Studio makes choosing your favourite and easy-to-read data presentation easy. You can choose between many formats like information, bar graphs, charts, line graphs, etc. You can also bold or change the font to emphasize and highlight your report.
2.2. Diverse data sources
One of the enormous advantages of the Google Data Studio feature is that you can aggregate substantial data sources from many different places into one place. In addition, when changing and updating data, your report will also automatically update to ensure the most accurate data.
2.3. Become more professional with impressive charts
If you are a person who is not too data savvy but still needs splendid reports with intuitive, vivid charts, then Google Data Studio is a perfect choice. You will be proactively customizing the period of the data for each chart. This will make measuring data over a massive time relative to the current date easier.
2.4. Easily share and enter data
Like Google Docs, Google Data Studio allows you to share your reports with anyone with a link. You can also proactively control who sees your reports by restricting who can comment, edit, and enter.
2.5. Google Data Studio is suitable for internal activities
The features of Google Data Studio will be used to the maximum and most perfect for internal activities to increase productivity, accuracy, and easy exchange and comment. When you have access to the same report, then comment and actively adjust, it will help you and your colleagues optimize time and proactively propose and evaluate each other.
3. Comparison between Google data studio and Power BI
3.1. Expense
Google Data Studio is a completely free tool to use. However, for Power BI, you will have to pay a fee. You will be able to use the free trial version, but you must pay a monthly fee to use all the features.
3.2. Feature
Both Power BI and Google Data Studio aim to improve user experience. Therefore, the features that these two tools bring are relatively easy to use and easy to learn. However, the more significant advantage of Google Data Studio is that it is easy to share and connect your work and collaborators with the report.
3.3. Ability to set up between Power BI and Google data studio
Power BI supports report deployment on both desktop and mobile, so building reports anywhere is super convenient. This is considered one of the potential trends and can develop in the future, helping people easily connect and share information.
Besides, Google Data Studio allows you to connect data from various sources: Google Analysis, Words, Google Bigquery, Google Cloud SQL, Google Sheet, etc. You can also easily share your reports with partners with just one link. Limiting the number of viewers and access rights is one of the outstanding features of Google Data Studio.
3.4. User interface
Google Data Studio and Power BI are easy-to-use interface tools, even for novices and beginners. Both are synchronized in their ecosystem. Therefore, you can handle the uniformity and unfamiliarity with the operations used in other tools.
4. A beginner’s guide to using Google data studio
Step 1: Collect data
To get the most out of the Google Data Studio tool, you should collect all your data from multiple sources in one place, like Google Bigquery. Platforms with data, such as Google Analysis, Facebook, My Target, Bing Ads, etc., must transfer the data to one place.
However, once you get used to the Google Data Studio tool, you can create reports from many sources through the data blending tool.
Step 2: Upload data to Google data studio
- In the main menu, select Data Sources
- At the top left corner of the screen, press the + button
- Select the desired connector. The most popular and preferred choice is Google Bigquery
- Provide Google Bigquery with data access
- Select project and account
- In the left corner, click Connect. At this point, all data will automatically be loaded into Google Data Studio.
Step 3: Once you’ve linked your data, you’re ready to build your report. Usually, visual elements will be divided into three groups:
- Elements for visualization
- Design elements
- Elements to filter
You click the Create Report button to go to the report page and create the report yourself according to your preferences. Then to be able to add a visual element. Just indicate which element you want to add and select the area where you want to add it.
At this point, you can choose the suitable chart templates for your report. In each chart, you can change the style, add parameters, metrics, sort, and filters.
In addition, to save time and use it as quickly as possible, you can also refer to and take advantage of the report templates included in the library of Google Data Studio. These report templates will help you complete the report in the shortest time.
Step 4: After completing the report, you can share your report with individuals or groups. In the File menu, select Open Access. In the right corner, press and Share button. You can then choose how you want to share.
5. Conclusion
Thus, you can create complete detailed data from Google Data Studio with just a few simple steps. Hopefully, through the above article from Cleverads, you will find a way to create the most impressive and professional report.