Google Analytics – How to increase website rankings

What is Google Analytics? Is it possible to take advantage of the functions of Google Analytics to increase website rank? How to improve the index of the website? Join CleverAds to find the answer in the article below.
Related articles:
List of Top 5 leading Google advertising companies in Vietnam What is Google Adsense?
Top 5 mistakes when using AdSense
Learn about current Google advertising services
1. What is Google Analytics?
Google Analytics (GA) is one of Google’s free SEO support tools (there are also Google Keyword Planner, Google Trend, and Google Search Console). GA allows the creation of a table of user data when they visit a specific website. Google Analytics also collects data about the digital presence of a business website.
According to recent figures, Google Analytics has supported more than 900 million websites in measuring, monitoring and improving website quality. Many websites have been able to improve traffic and increase brand awareness thanks to the data provided by Google Analytics.
2. How Google Analytics Works
Google Analytics helps businesses to statistics, analyze and evaluate websites and the effectiveness of Digital Marketing activities. The following 4-step mechanism assist Google Analytics do just that:
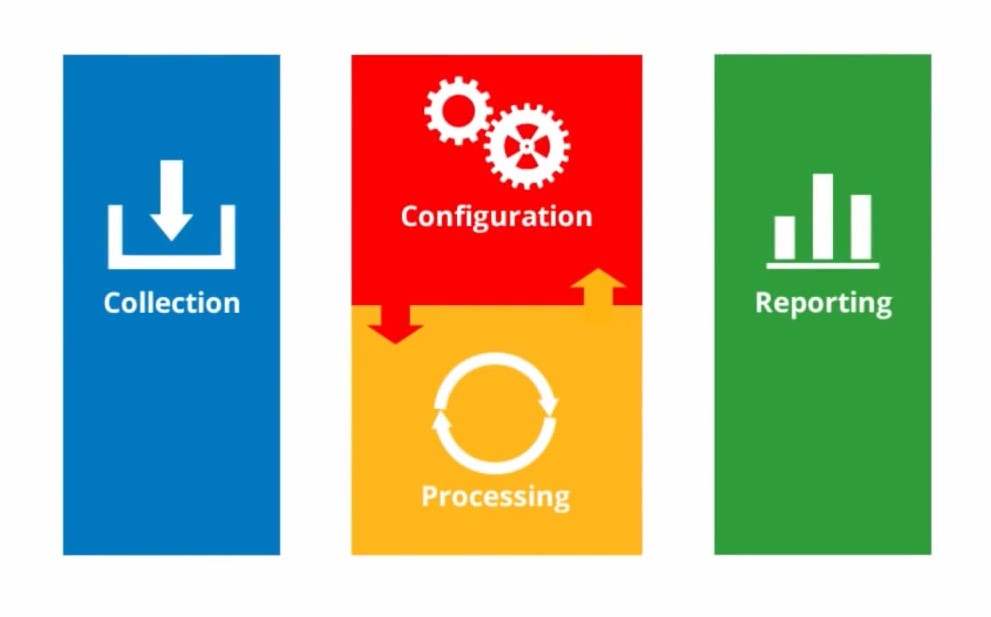
Step 1: Data Collection – collect data
Collect user interaction data.
Step 2: Configuration – data transformation
Allows website owners to manage converted data.
Step 3: Processing – select the index you want to track
Process user interaction data through converted data
Step 4: Reporting – report
Report processed data
3. Take advantage of the functions of Google Analytics to increase your website rank
3.1. Real-time statistics
With this function, the website owner can monitor:
Number of visitors to the website at the time of testing.
Marketers may know:
Golden time has the highest number of visitors.
From there it is possible:
Implement the right posting strategies.
3.2 Collect information about website traffic sources
In addition to providing information related to user traffic on the website. Google Analytics also allows us to know the following information:
What channels do users come to your website through?
What operating system are they using?
Is the device fixed or mobile?
Since customers come from many different backgrounds, each with its unique approach, businesses should leverage this information to:
Choose the right content strategy to reach the maximum number of customers.
3.3 Track user habits on the website
Through Google Analytics, website administrators can know the exact habits of users on their website:
What articles are being studied the most?
What is the average time on the page?
Bounce rate
Through data on the average time to stay on the website during a user visit, Google Analytics can: Measure and recognize user behaviour.
Through these insights, marketers can: Focus on promoting the content of interest; Promptly improve if readers are not pleased with the content.
3.4 Traffic analysis
Demographic metrics also included by Google Analytics for traffic analysis: Sex, Interest, Geographical location
Through data collected via location servers or user cookies, businesses can: Draw portraits of people who visit your website, Compare and expand target customers.
From there, adjust SEO and business strategies accordingly.
4. Principal Google Analytics metrics and how to improve them
4.1 User (User)
The metric shows the number of users who visited the website during a selected time.
To view the number of users:
In the Audience section, click “Overview”.
Then the screen will display the box “Users”, click this box.
Improved user metrics:
Enhance quality backlinks
Plan content on other platforms where the target audience appears (Facebook, TikTok, Instagram, LinkedIn, etc.)
Create Email list
Turn your website into an expert in its field
Set a title that hits the target audience’s insight
Edit the brief description (Meta Description) to attract, exactly what viewers want to see
Run ads for the website
4.2 Session (Session)
The index shows the number of user actions when accessing the website and interacting with the website. A user with multiple sessions means that they have returned to the website many times.
The session will help businesses understand the total number of times users interact with the website. In case the user accesses the website but has no interaction and exits later, we call it a single-page session, a single-page session has session duration = 0.
How to calculate the session:
The session is computed when a user has just visited the website. After 30 minutes of no interaction, the user performs other interactions with the website such as: switching to another page of the same website, viewing products, zooming in, and copying text… will be counted as a new session.
The session will end when the user closes the browser and no longer interacts with the website. Or after 30 minutes, there is no interaction between the user and the website (the user closes or hangs the page for 30).
Improved session:
Put an Internal link related to the article
Create meaningful content
Create a table of contents for the article
4.3 Pageviews (Pageview)
The metric shows the number of pages viewed by the user. Pageviews are counted every time a user visits the website, even without any interaction, leaving immediately after.
Increase pageviews:
Enhance quality backlinks
Plan content on other platforms where the target audience appears (Facebook, TikTok, Instagram, LinkedIn, etc.)
Create Email list
Turn your website into an expert in its field
Set a title that hits the target audience’s insight
Edit the brief description (Meta Description) to attract, exactly what viewers want to see
Run ads for the website
4.4 Bounce Rate
The metric shows the number of times a user visits the website and exits but does not perform any action. From there, it helps to know if the content on the website is good or not. Pages with a high bounce rate will be underestimated by Google.
Reduce bounce rate:
Pay attention to the page load time
Add a search feature on the page
Insert an internal link (Internal link)
Make sure links are opened in new tabs
Regularly publish new and useful content
Show the credibility of the website
Navigate users to the destination they want to go to
Pay attention to the page design
Mobile-friendly page design
Make articles easy to read (bold, italic, underline, bulleted, …)
Write shorter paragraphs Use a variety of content (images, text, videos, etc.)
Use keywords related to the content
Target relevant audiences
Limit the display of popups and ads that distract readers
Remove broken links
4.5 Average time per session
The metric shows how long an active user on the website stays. The longer the user stays on the page, the more useful the content proves, making the user stay longer.
Produce new and useful content Insert an internal link (Internal link)
Make sure links are opened in new tabs
Use a variety of content (images, text, videos, etc.)
Use keywords related to the content
Target relevant audiences
4.6 Pageviews per session (Avg. pageviews per session)
Depending on the characteristics of each website, the number of pages/sessions has a different rating. For example, a knowledge-sharing website will have a higher number of pages/sessions than a landing page.
Improved page count/session:
Produce new and useful content
Insert an internal link (Internal link)
Make sure links are opened in new tabs
Use keywords related to the content
Target relevant audiences
4.7 Conversion Rate (Conversion Rate)
The conversion rate of the website is calculated when a user visits the website and takes action for the right purpose of the business such as:
Visit the website and purchase/download the app
Visit the website and leave information
Increase conversion rate:
Use testimonials from customers on the website
Simplify purchase steps
Minimalist website design
5. How to use Google Analytics
Four (4) steps to effectively use Google Analytics:
- Install Google Analytics
- Install the Google Analytics (Tracking Code) code
- Set goals
- View analysis reports, and data statistics from the website
Businesses should read this section even after GA has been installed to see some essential installation notes.
Note: Site owners should use an account that only they have access to create an account on GA and not let anyone else do it. Because then, they will be able to fully manage it.
When two parties no longer cooperate. They will take all of the site’s Google Analytics data with them, and the business will have to start from scratch.
Step 1: Set up an account (Account) and properties (Property)
First, the login steps: Have a Google account Direct access to Google Analytics or through a linked Google Ads account Click the sign-in button at the top and then select Analytics.
If you are already logged into your Gmail account, you will be taken directly to the Google Analytics interface. Otherwise, you will be prompted to sign in to Gmail as usual. The interface will then show the steps you need to take to set up Google Analytics.
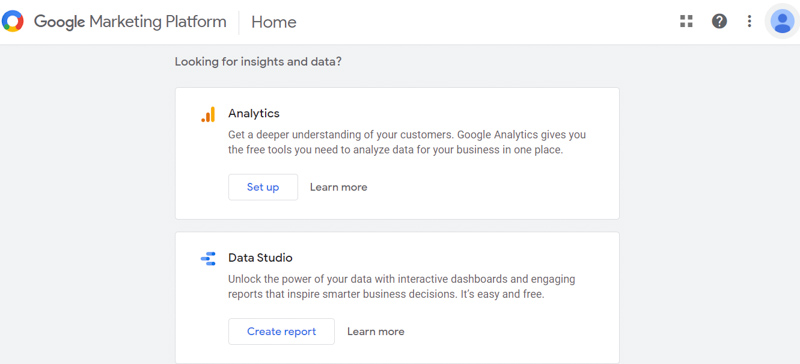
The interface when accessing Google Analytics Click “Set up” to set up your GA account Click “start measurement”.
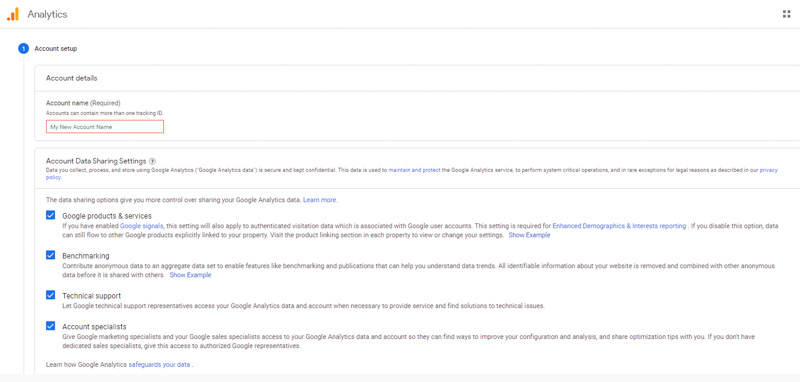
Next are the steps to set up the account.
Set up account name information
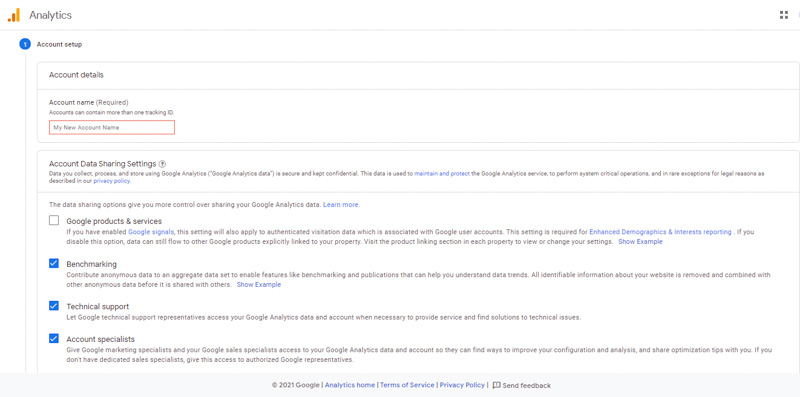
Set properties
Declare business information and click “Create”.
After confirming the information, and agreeing to Google’s requirements, click “I agree”.
Completing these steps, you should have a new Google Analytics account.
From one Google account, you can set up up to 100 Google Analytics. You can set up to 50 website properties in one Google Analytics account, and 25 views in one website property.
Possible situations
If you only have one website: you only need one Google Analytics account with one website property.
If you have two websites, such as a business website and a personal website: you can create two accounts named “123 Business” and “Personal”. You will then set up your business website in your “123 Business” account and your website in your “Personal” account.
If you have multiple businesses (less than 50), each has its website: you can put them all in one Google Analytics account called “Business”. Then you set up a “Personal” account for your website.
If there are many businesses and each business has dozens of websites (about over 50 websites): you can set up an account for each business, such as 123 Business, 124 Business.
The choice of which of the 4 options above to set up a Google Analytics account depends on how you want to organize your websites, you can change the account name and properties.
Note: Property (website) cannot be moved from one Google Analytics account to another. You have to set up properties in the new account and have to start collecting data from scratch.
Let us say you already have a website and just need to do a view (default, see all data). Let us set it up as follows:
Set up properties in a new account and collect data from scratch
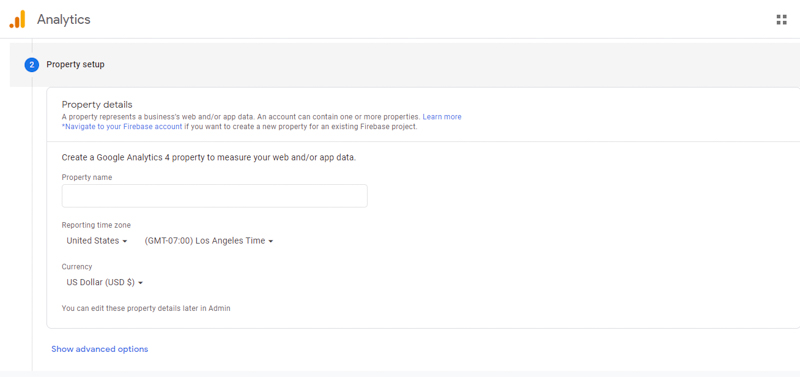
Next is to set properties, time zone, regions, and currencies.”
Step 2: Install the tracking code (Tracking ID)
Once you have set up your Google Analytics account
- Click the Get Tracking ID button.
- See a popup showing the terms and conditions of Google Analytics appear => Agree to those terms and conditions => Get Google Analytics code
- Copy this code
![]()
It is necessary to install the tracking code on each page of the website, and that installation will depend on the specific type of website.
Besides, if you use WordPress on your domain. You can use Google Analytics with the Yoast plugin for easier code installation, no matter what theme or framework you are using.
If your website is built using HTML files, you can add a tracking code before the tag of each page.
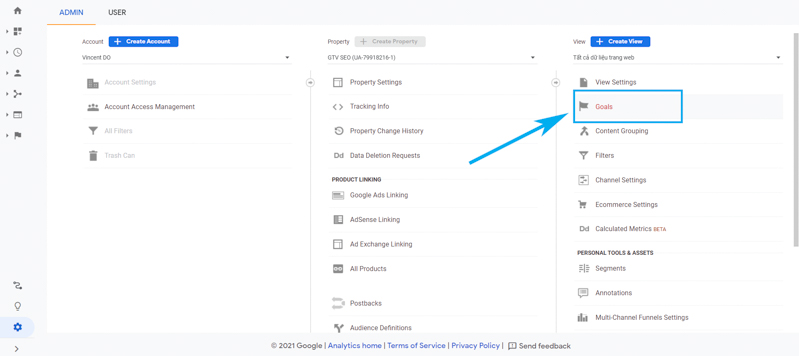
Step 3: Set goals
Click on the Admin section at the top of the Google Analytics page
Click on the Goals section located in the View column.
The Goals section will notify Google Analytics every time something important happens on the website. For example, if you’re attracting potential customers through contact forms on your website, you’ll have to find (or create) a thank you page that’ll show up as soon as the visitor completes it. their contact information.
Or if you have a sales website, you will have to find (or create) a thank you or confirmation page. These pages will be displayed as soon as the visitor completes the purchase.
These pages will typically have URLs like this:
http://123business.com/thank-you
http://123business.com/thank-you/
http://123business.com/thank-you.html
- Click on NEW GOAL to create a new goal
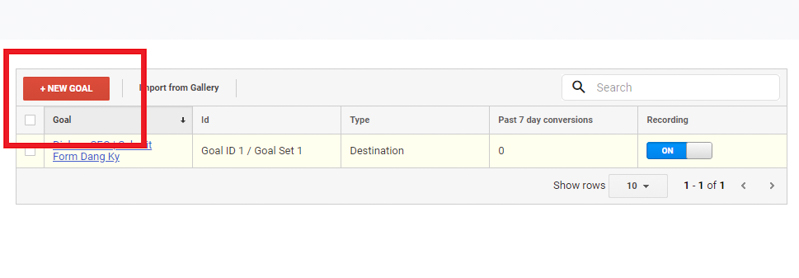
- Select Customizations (No need to do this if the website already applies one of those options.
- Click the Next Step button.
- Name your goal
- Select Destination
- Click the Next Step button.
- Enter the URL of the thank you page or the confirmation page after the .com section of the website in the Destination field
- In the drop-down list located to the left of the Destination field, select “Begins with”.
- Click the OFF button of the value field and enter the specific value to convert (if any) and click “Save” to complete the setup.”
If you want to track similar goals or conversions on your site, repeat the steps above. A website can create up to 20 entries.
Step 4: Set up site search
Another factor that you can set up quickly but yield a lot of valuable data is site search. You can do this for websites that have a search box, such as the search box at the top of the Moz page.
- First, run a search on the website. Then keep this tab, you will see the URL (similar to the image below).
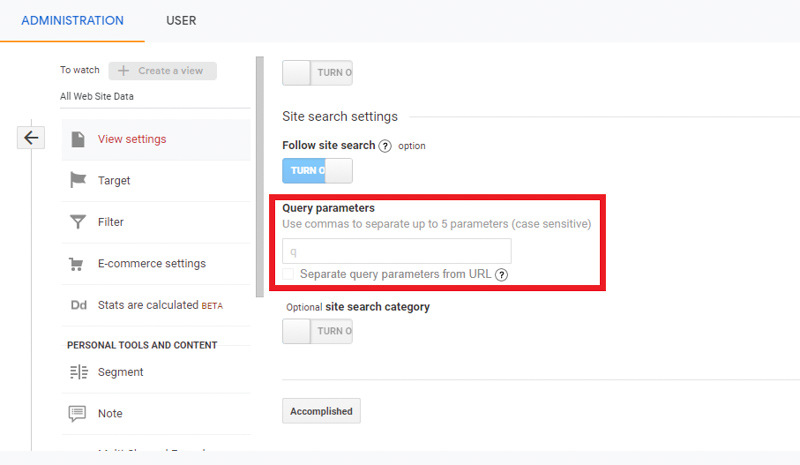
- Go back to the Admin Menu in your Google Analytics account and the View column, and click View Settings.
- Scroll down until the Site Search Setting section and toggle it to On.
- Look again at the URL in the search results. Enter the query parameter (usually s or q) and press Save. For example on Moz, the query parameter will be q.
This allows Google Analytics to track any searches performed on the website. As a result, you can learn more about what visitors are searching for on a particular page.”
Step 5: Add additional accounts and properties
If you want to add a new Google Analytics account, you can do so by returning to the Admin panel and then clicking the Create New Account link.
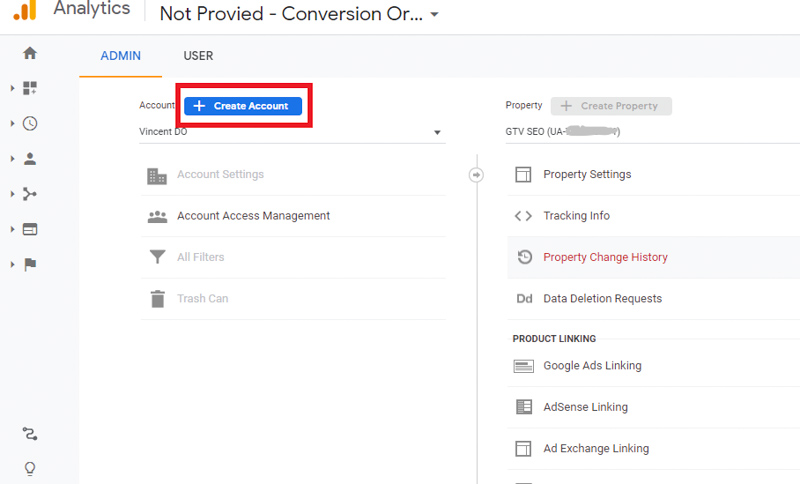
Similarly, if you want to add a new website to your Google Analytics account, you can also do this in the Admin Menu, and click Create Property.
Then you can continue with all the steps mentioned above. Once you’ve installed Google Analytics on one/more websites, set up your goals and found your site, you should wait about 24 hours for Google Analytics to start receiving data. You can then view your data.”
Step 6: View data in Google Analytics
Once you get your Google Analytics data, you can start learning about the traffic to your website.
- Sign in to your Google Analytics account
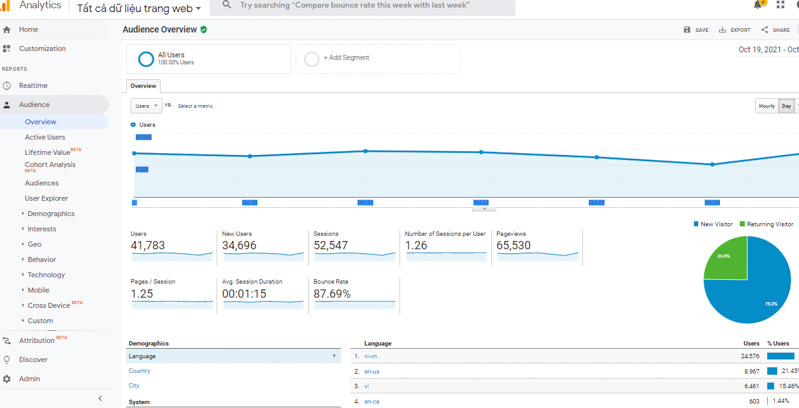
- View the Audience Overview report
Besides, if you have multiple websites, select a website from the list of websites, then view the Audience Overview report of that website. This is the first of more than 50 reports available in Google Analytics. You can also access other reports by clicking the Reporting link located at the top of the page.
Step 7: Standard reporting features
Most of the standard reports in Google Analytics will be similar to this.
To switch to other websites in your Google Analytics account:
At the top left, click the drop-down arrow next to your website. Or click the Home link at the top.
You can hover over multiple areas of the Google Analytics report for more information.
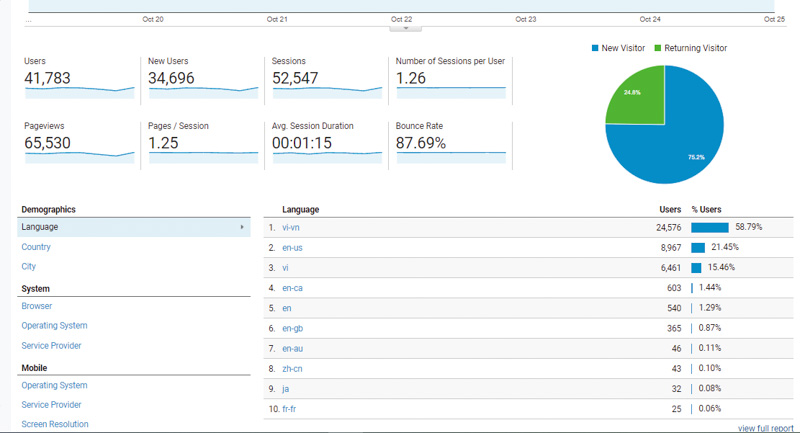
For example, in the Audience Overview section, if you hover over the line above the chart, you will see the number of sessions on a particular day. Hover over the indicators below, the chart will tell you what each indicator means.
Below the key metrics are reported on the top 10 visitor languages, countries, cities, browsers, operating systems, service providers, and screen resolutions.
You can click the Report link on each section to see the full report. Or you can also click on any of the first 10 links to see details.”
For example:
Clicking on the United States in the Countries section, you’ll see the full Location report, focused on visitors from US states.
Scroll and point to details to view more information.
Step 8: Types of Google Analytics Reports
Here’s a summary of what you’ll find in each standard Google Analytics report section:
Each section is a specific report or set of reports that you can refer to.
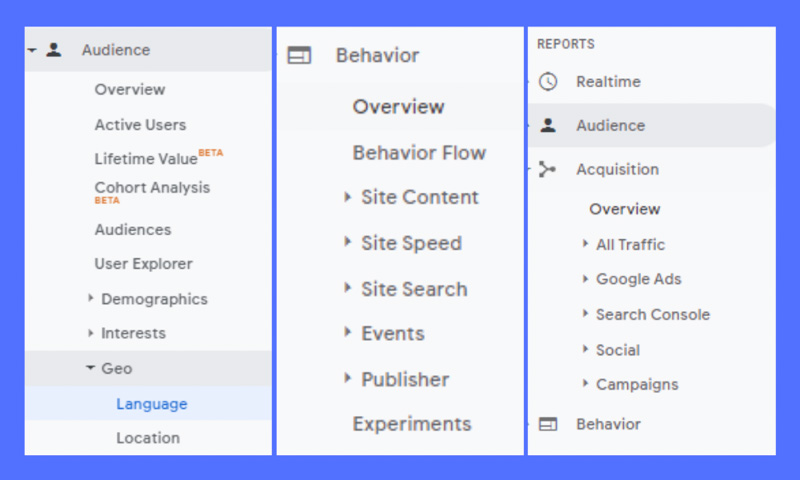
Audience (object)
Visitor Information: Age, gender (in the Demographics section); Their common interests (in the Interests section; Where do they come from (Geo > Location section); What language do they use (Geo > Language section); How often do they visit the website (under the Behavior section); The device they use to access the website (under Technology and Mobile).
Acquisition (conversion)
These reports will give you information about what drives visitors to visit your website (under All Traffic).
Traffic is broken down into major categories (All Traffic > Channels section) and specific sources (All Traffic > Source/Medium section).
Besides, you can also learn about traffic from social networks (Social section). You can connect Google Analytics to AdWords to learn more about PPC campaigns. Can also connect to Google Webmaster Tools/Search Console to learn more about search traffic (Search Engine Optimization).
Behaviour (behaviour)
These reports will tell you information about the content. Especially the first pages on the website (Site Content > All Pages section), the top pages where users start surfing sessions on the website (Site Content > Landing Pages section), and the top last pages that users view. in one visit and exit (section Site Content > Exit Pages).
If you set up a site search, you can see what terms are searched for (Site Search > Search Terms) and what pages are displayed after a user searches (Site Search > Pages).
You can also learn more about website loading speed (Site Speed section) as well as find specific Google suggestions to increase website loading speed (Site Speed > Speed Suggestions section).
Real-time
To view real-time reports, go to Google Analytics (GA) and select the account you want to view by clicking the drop-down arrow in the top left corner. Then in the Report section, click Realtime.
In the real-time reporting section of Google Analytics, there will be 6 parts:
Overview report: Shows you the number of users, page views and time (minutes) of active users on the website at the time of viewing.
Location Report: This lets you know where the user is visiting the website from (country, province/city, etc.)
Traffic source report: You will know from what traffic sources users visit your website. Those sources can be from Google, social channels, direct access…
Content reporting: You will know what content is being viewed by users and from what source users come to the content on the website.
Event Reporting: You will be able to check what events have just happened in real-time.
Conversions report: This table shows the 20 recently completed goals in their session, the number of users, and the percentage of total users.”
Step 9: Convert
If you set up goals in Google Analytics, you can see the number of conversions your website has received (under Goals > Overview) and random URLs (Goals > Goal URLs). You can also see the path the visitor took to complete the conversion (Goals > Reverse Goal Path section).
Most tables in standard Google Analytics reports will link specific data to conversions. For example:
See the number of conversions made by visitors from California in the Audience > Geo > Location report.
Know the number of conversions made by visitors from Facebook in the Acquisitions > All Traffic > Source/Medium report section.
Check the number of conversions made by website visitors from specific pages in the Behavior > Site Content > Landing Pages report.”
If you have multiple goals, you can use the drop-down list at the top of the page to select which sections you want to see.”
6. Frequently asked questions about Google Analytics
6.1 How to share Google Analytics data with others?
You do not need to provide Google account information nor access to Google Analytics data to that person. Instead, go to the Admin menu, and select the User Management menu of one of the three columns Account, Property (website) or View.
From there, add the email addresses of the people you want to show Google Analytics data to and select the permissions you want to grant them.
6.2. I have a lot of websites but don’t want to check Google Analytics of each website every day. So what should I do to solve the above problem?
You have two (2) options:
Go to the main screen of Google Analytics. You’ll see a list of all your sites and an overview of the top metrics including sessions, average session length, bounce rate, and conversion rate.
Try some control panel solutions, such as Cyfe. For as little as $19/month, you can create unlimited dashboards with tons of widgets, including a wide selection of data from Google Analytics, from social networking sites, keyword rankings, and numbers. Moz’s stats.”
This solution saves website owners from having to spend too much time just looking at large-scale analytics.
6.3. Google Analytics reports that over 90% of my organic search keywords are reported as (not provided). So where can I see that information?
(Not provided) is Google’s way of protecting user privacy. Google hides the keywords that users used in the search engine to access your website. Tools like Google Search Console (free), Authority Lab sourcing reports (paid) and Hittail (paid) can help you discover those keywords.
They will not be linked to your conversions or other Google Analytics data. But at least you’ll have some more clues about what keywords users entered to search for your site.
6.4. Is it possible to track Google AdSense ad campaigns on Google Analytics?
Have. Currently, Google Analytics has supported statistical measurement of the effectiveness of Google AdSense advertising campaigns. You can see which sites are getting the best revenue from Google AdSense ads.
Conclusion
Thus, through the article, marketers have understood how Google Analytics works, the important metrics of the website and how to improve them.